Climate change scenarios
This pilot considers four climate change scenarios, developed by the Royal Dutch Meteorological Institute - KNMI. The latest KNMI scenarios are from 2023.
As depicted in the figure on the right, two scenarios of greenhouse gasses emissions have been considered: 'H' (High - increase at the same rate until 2080 and then levelling off, resulting in global warming of 4.9°C by year 2100, compared to pre-industrial era) and 'L' (Low - in line with
the Paris Agreement to limit global warming to well below 2°C, resulting in global warming of 1.7°C by year 2100). These emission-related scenarios are then combined with two scenarios of 'wetness': ‘wet’ scenario (denoted by a lower case ‘n’, from ‘nat’ in Dutch), in which the
winters are much wetter and the summers slightly drier, and ‘dry’ scenario (denoted by a lower case ‘d’), in which the winters are slightly
wetter and the summers much drier. These combinations lead to the four climate change scenarios: 'Hn', 'Hd', 'Ln' and 'Ld', considered in the analysis of the Aa of Weerijs catchment. (KNMI'23 climate change scenarios also include two additional scenarios with medium emissions, which are not considred here). The scenarios are prepared for two different 30-year periods in the future, centered around years 2050 (period 2036-2065) and 2100 (period 2086-2115), for which the results are then compared to the reference condition of 1991-2020.
Data from these scenarios are used for assessing the hydrology in the Aa of Weerijs catchment under climate change, by comparing current climate (in decade 2010-2019) to future climate change (in decade 2050-2059). The figures below show predictions for temperature and precipitation under the climate change scenarios.
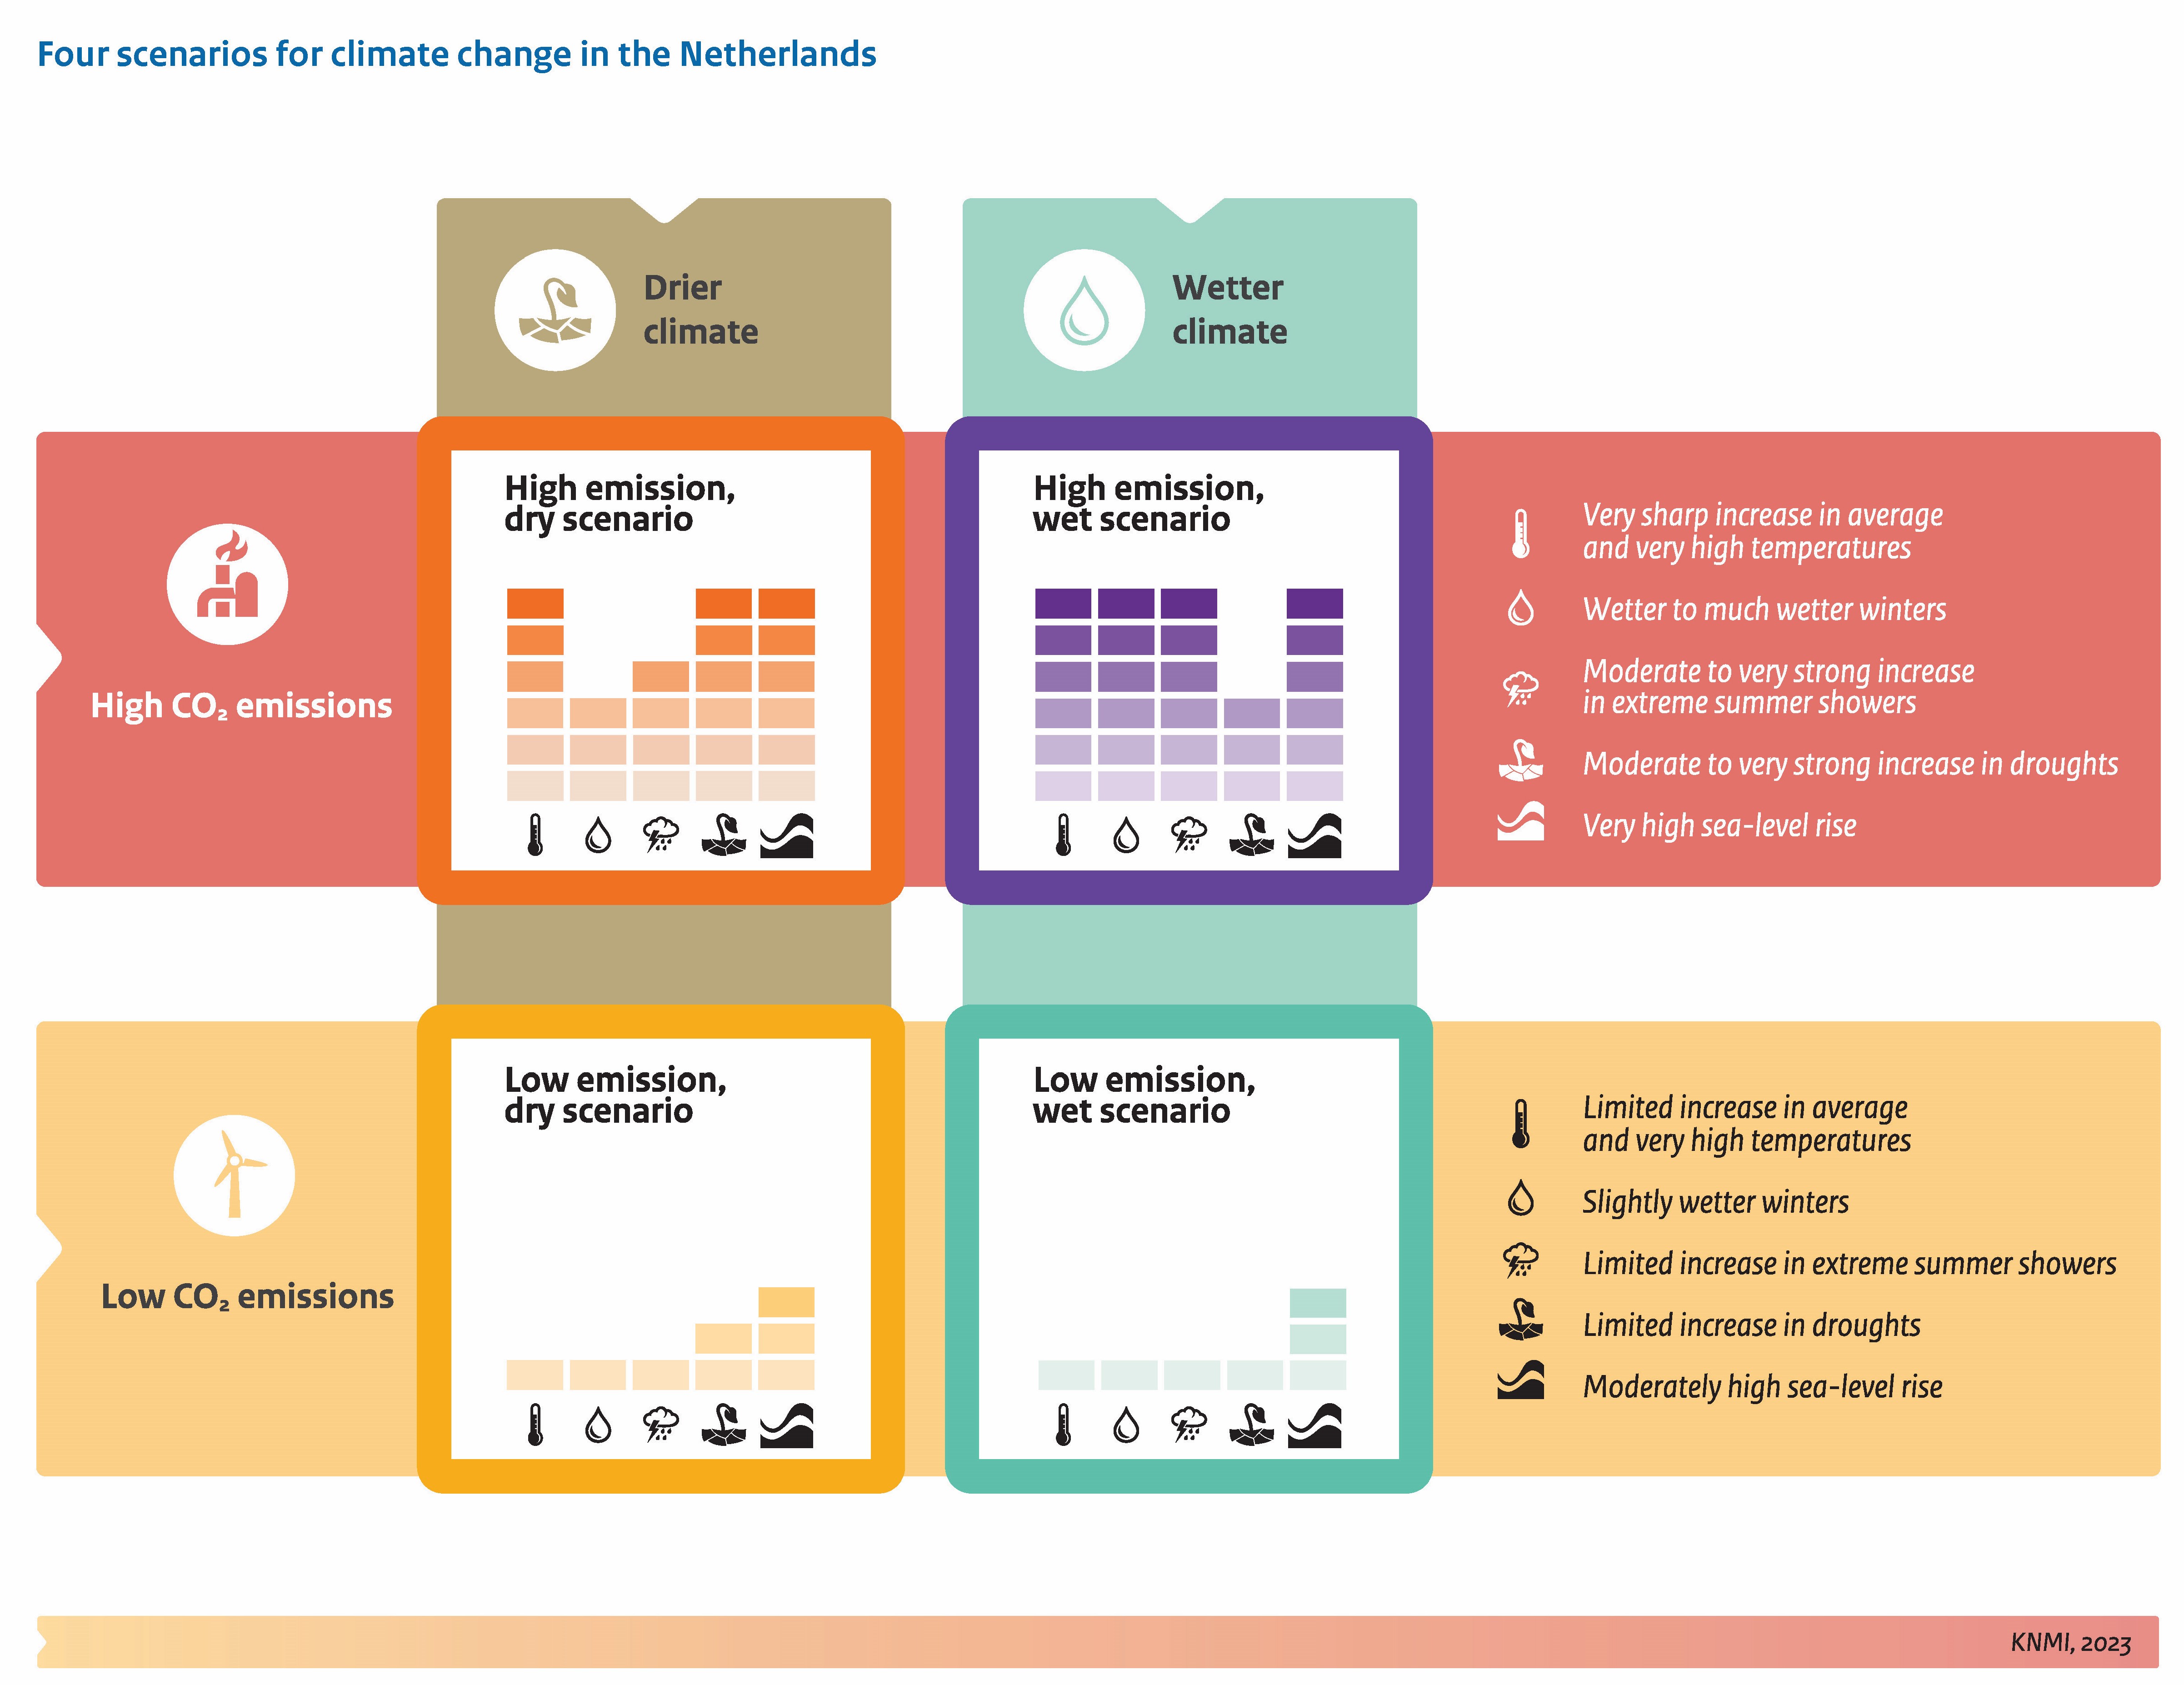
Conceptual representation of the four KNMI climate change scenarios (Source: User Report KNMI'23 Climate Scenarios)
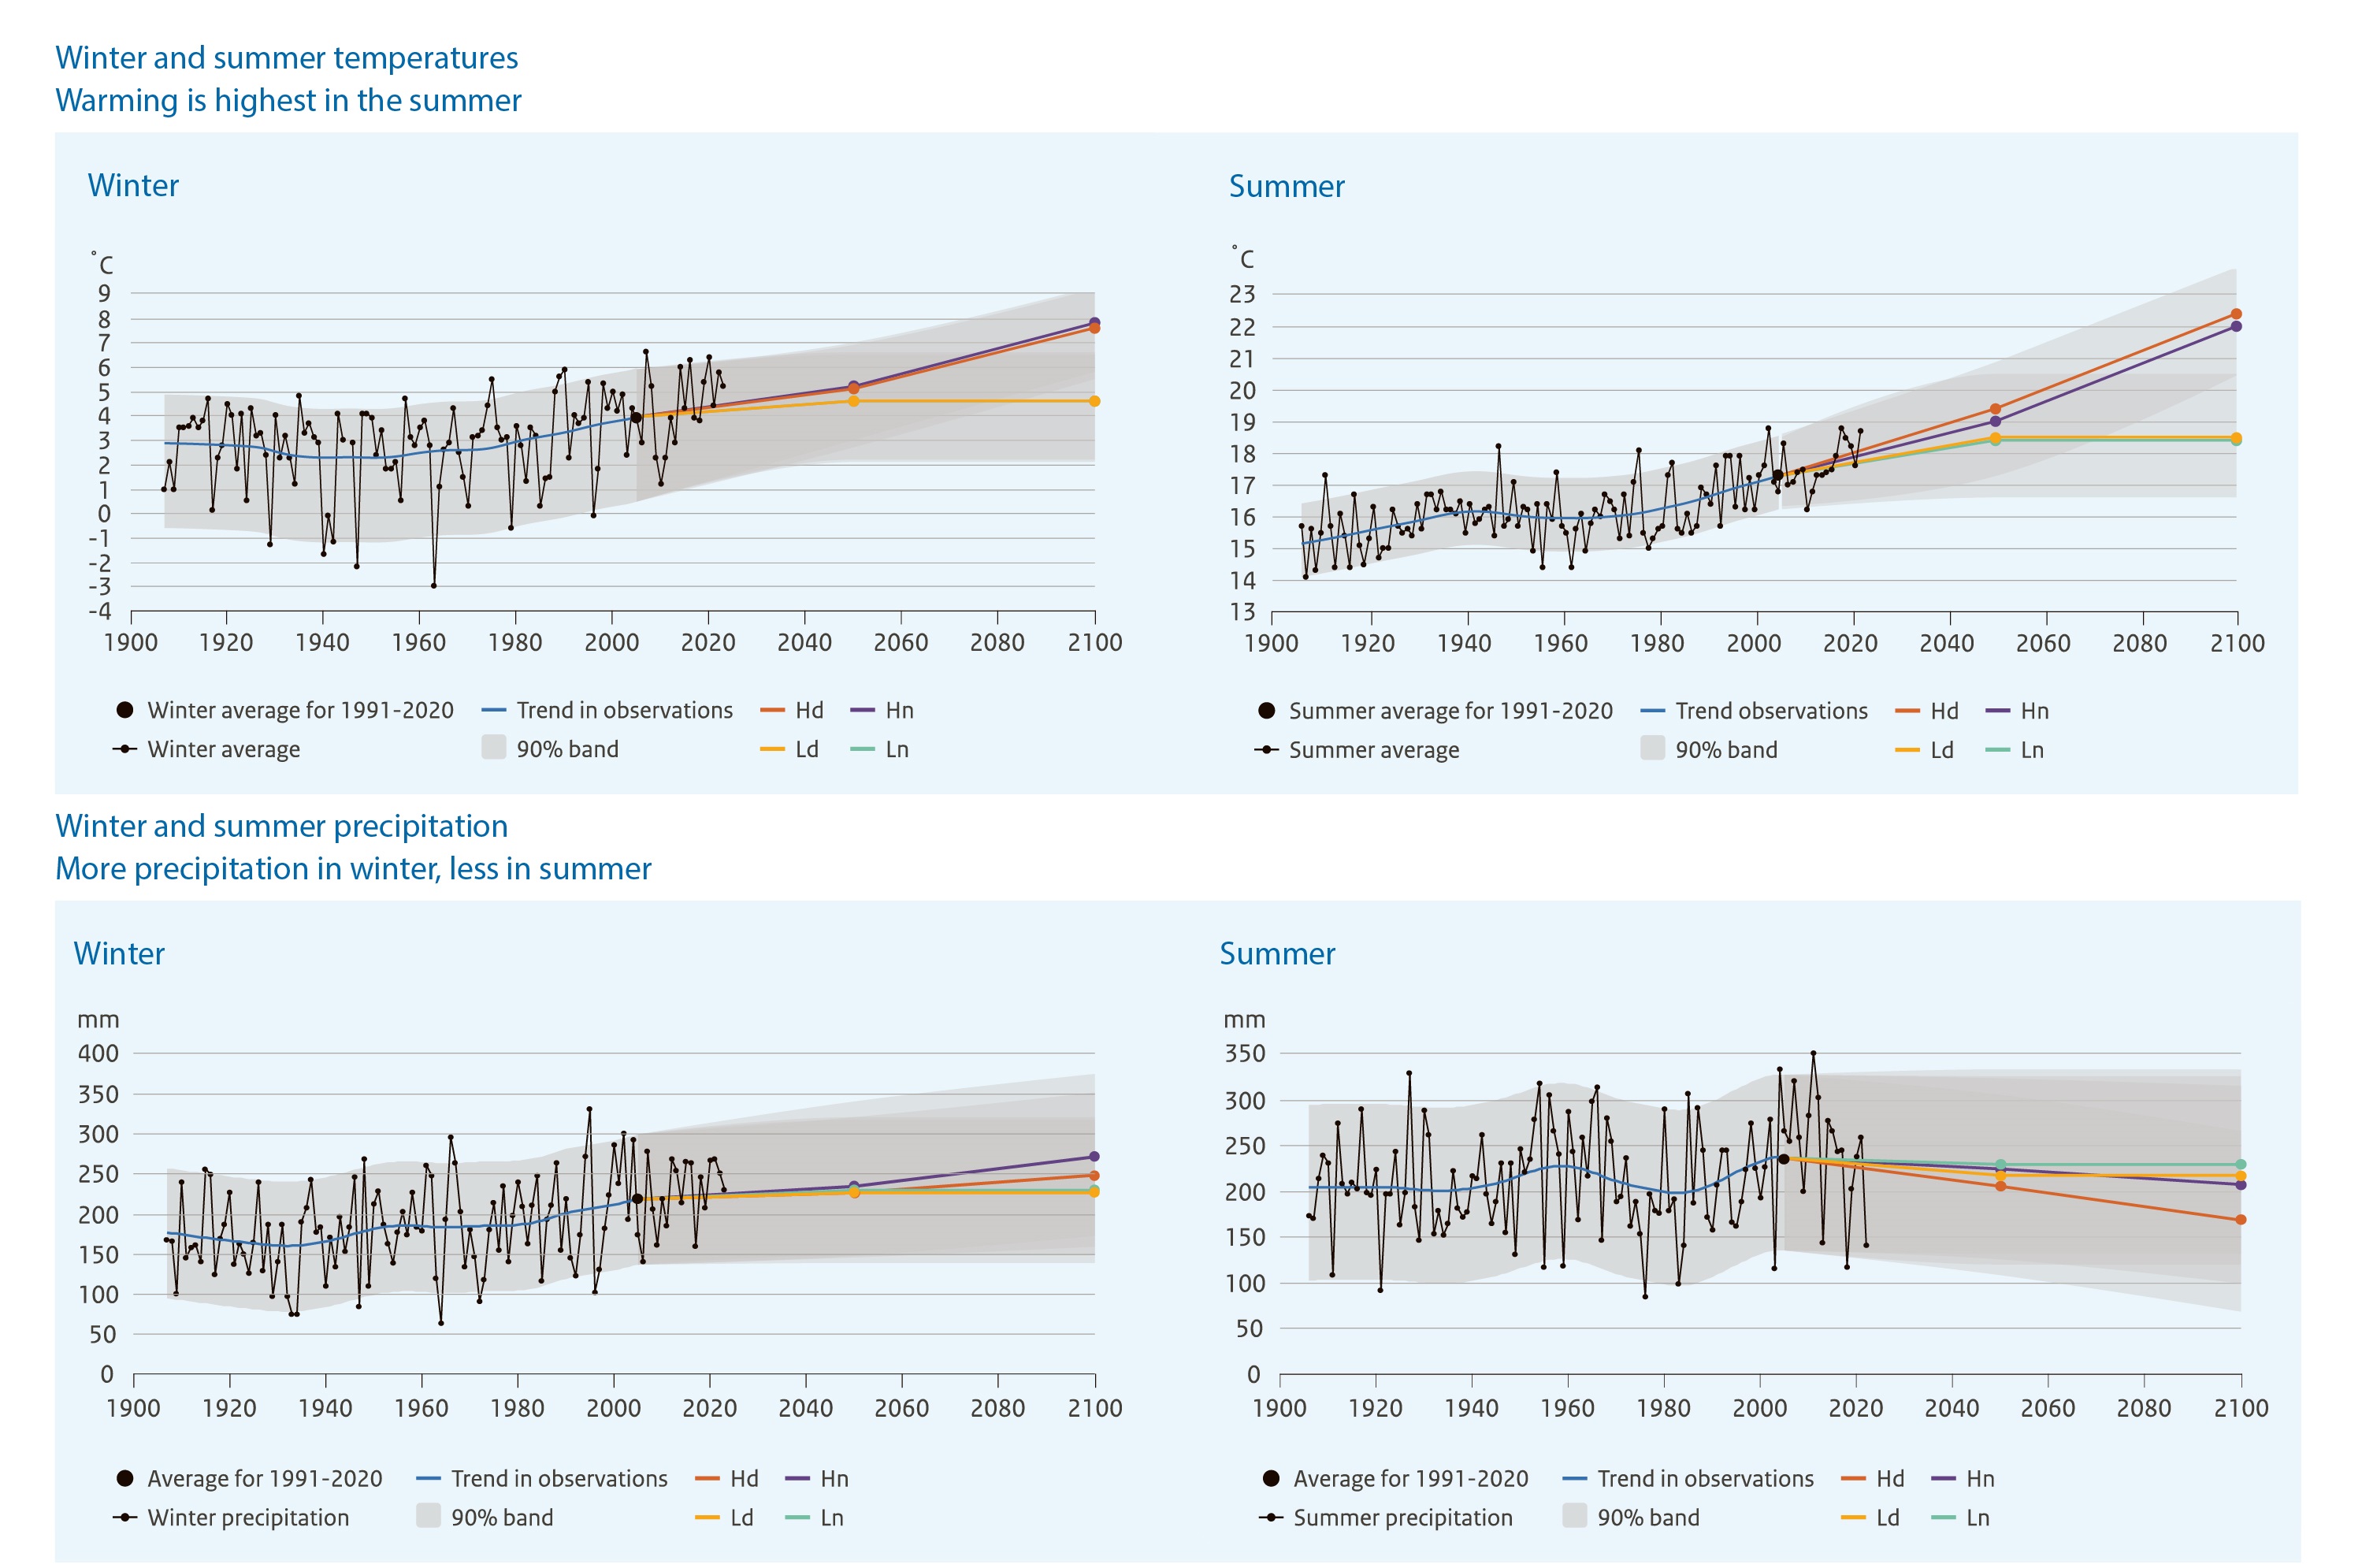
Winter and summer temperature and precipitation in the Netherlands under climate change: Top - Temperature, Bottom - Precipitation (national averages). Observations (black) and the four KNMI’23 climate scenarios (2050 and 2100, in four colours); (Source: User Report KNMI'23 Climate Scenarios )
The modelling and KPI results showed that the hydrological conditions under the 'H' scenarios are with significant changes, with more severe droughts during summer. Under 'L' scenarios the conditions are marginally more severe compared to the base period used in Pilot 1 (2010-2019).
Use the tabs below to see summary results of the main forcings (precipitation and potential evepotranspiration), as well as KPIs variation under these climate change scenarios. The climate change period used in this analysis is relatively near-by, namely the decade of 2050-2059.
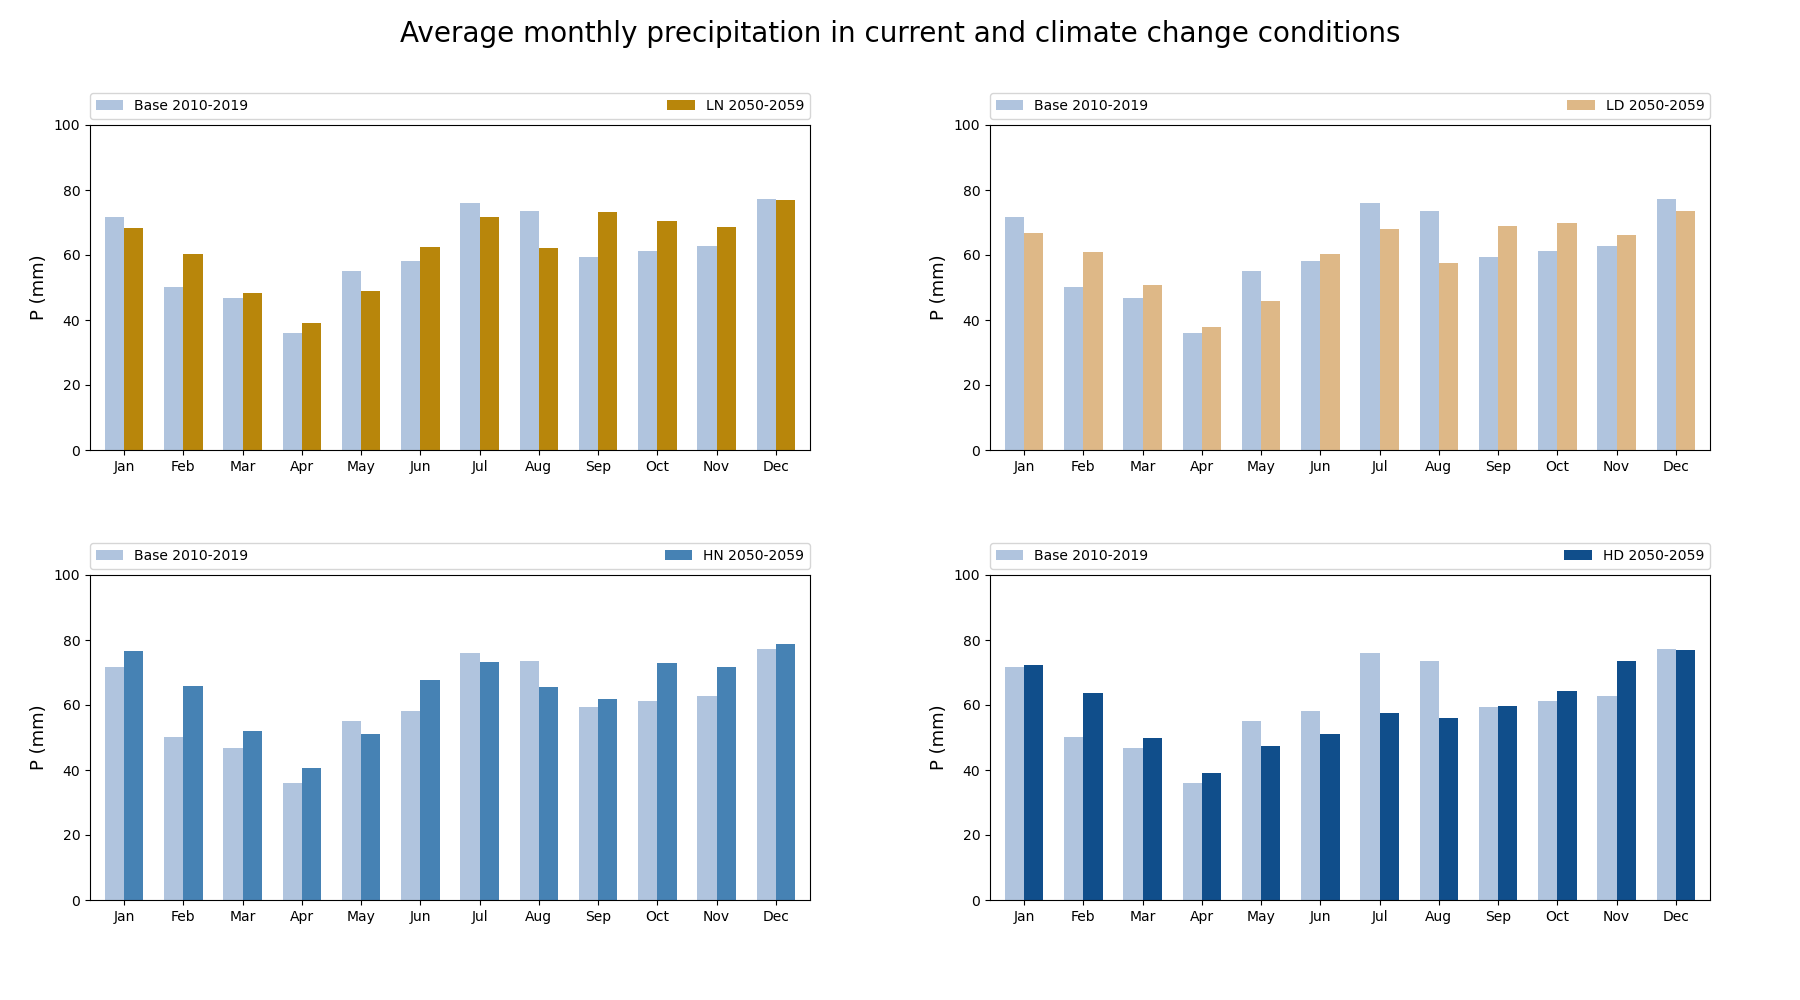
Monthly precipitation - average for current decade and for 2050-2059 under four CC scenarios
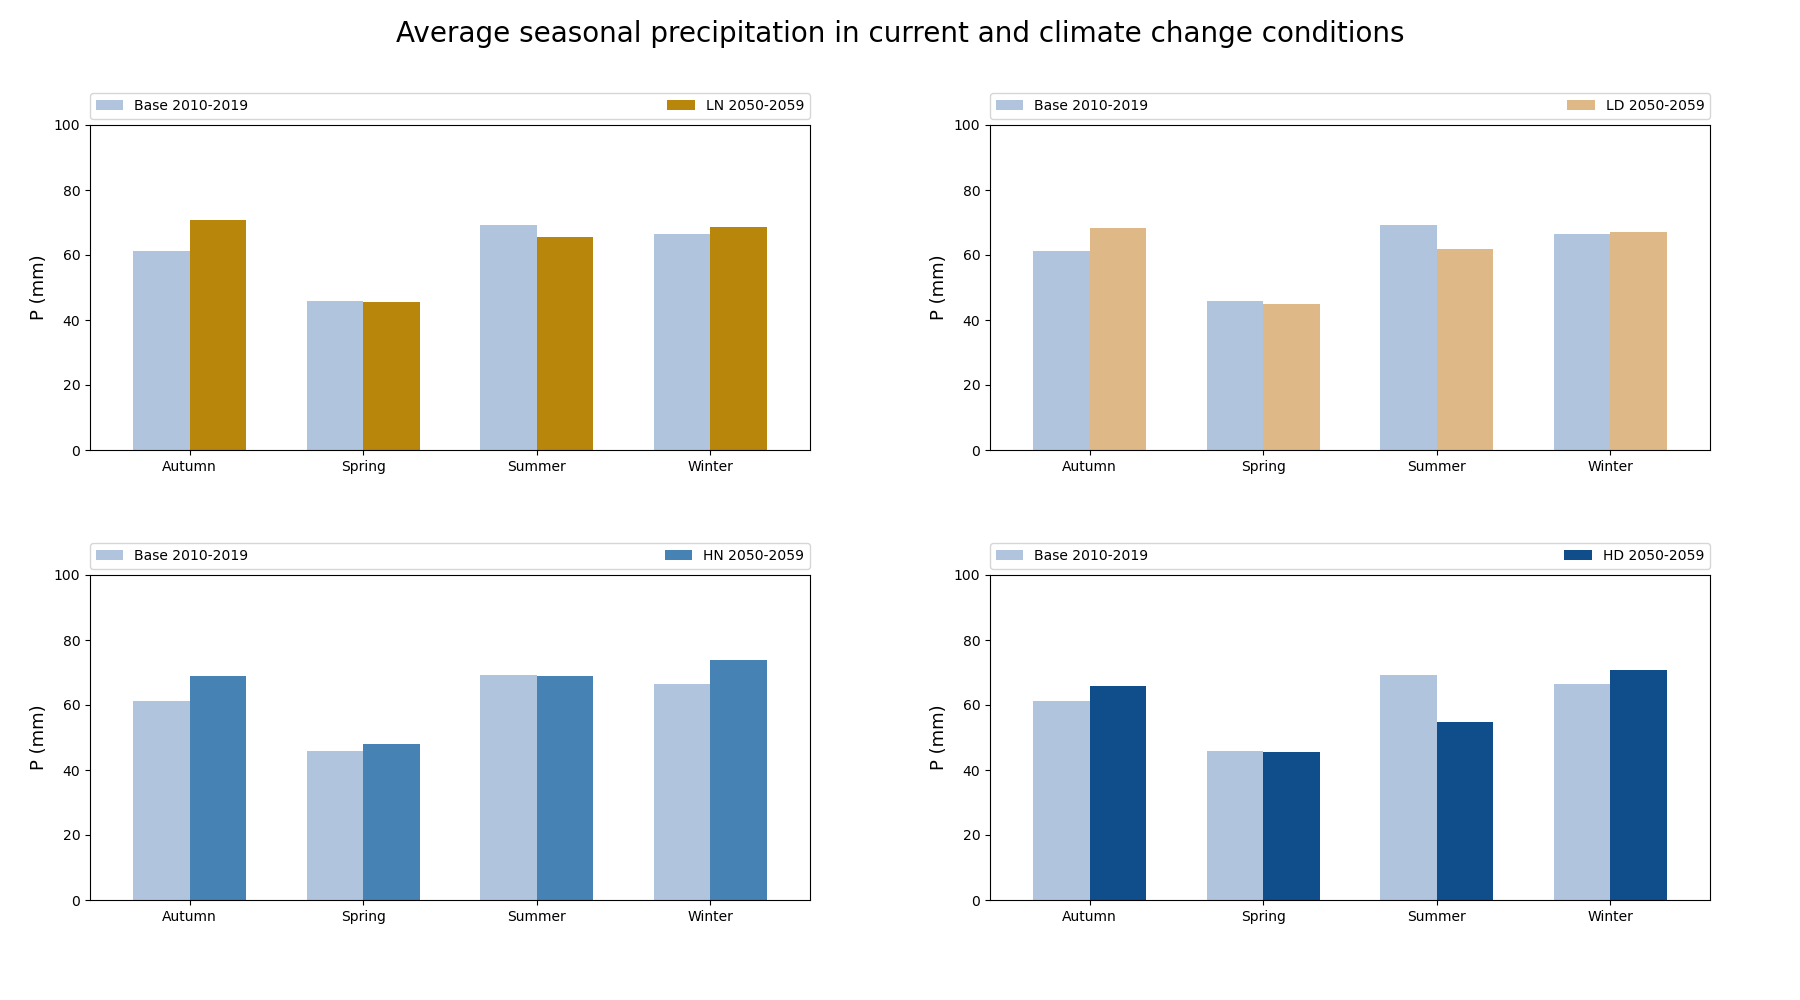
Seasonal precipitation - average for current decade and for 2050-2059 under four CC scenarios
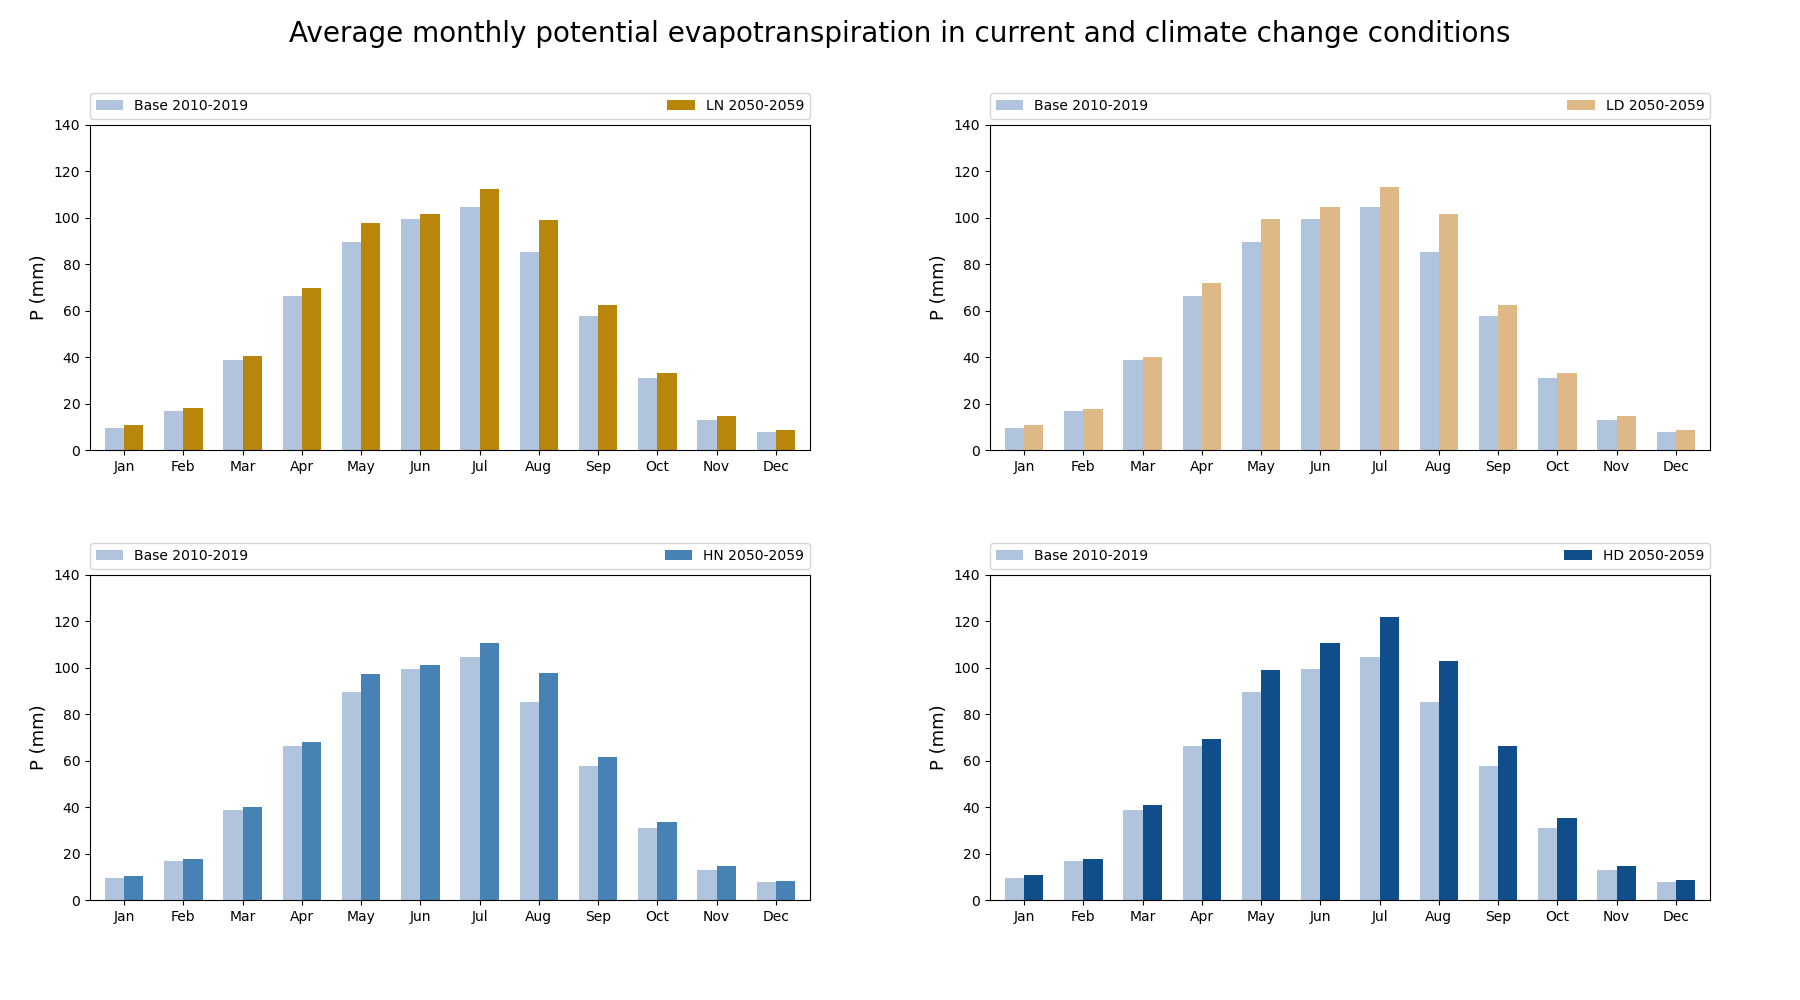
Monthly Potential evapotranspiration - average for current decade and for 2050-2059 under four CC scenarios
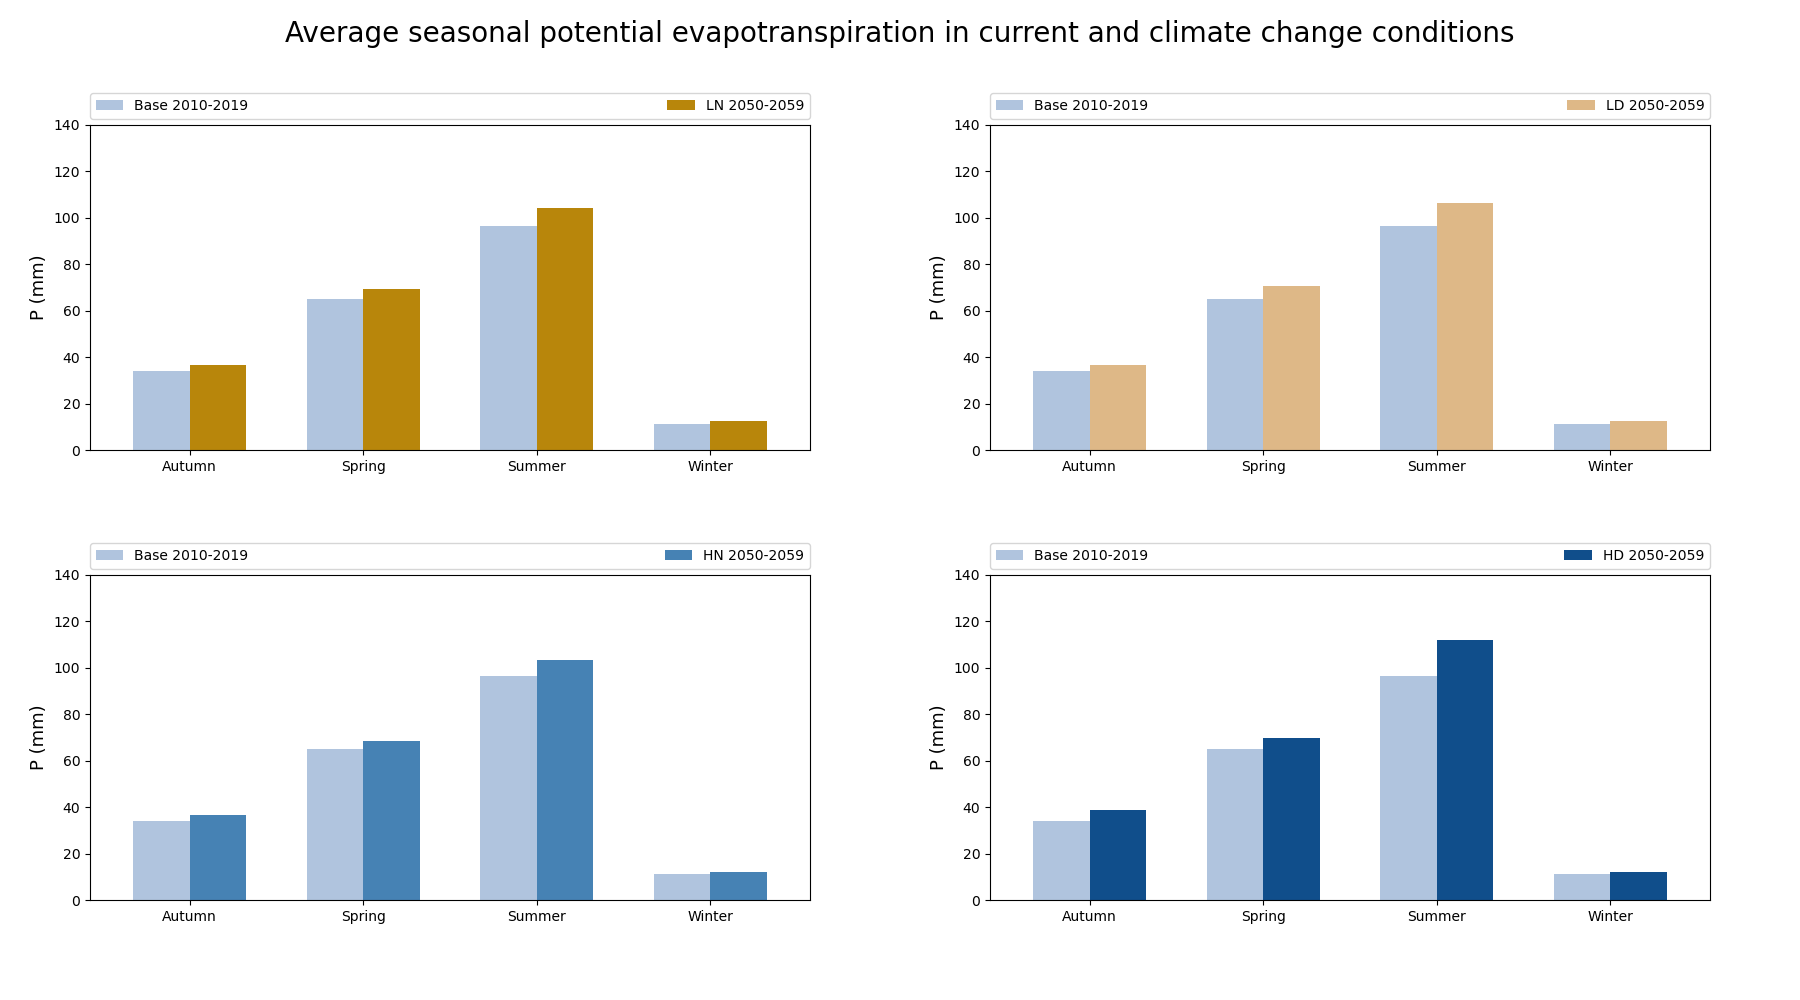
Seasonal Potential evapotranspiration - average for current decade and for 2050-2059 under four CC scenarios