Hydrological model description
The model of aa of Weerijs catchment has been developed with the MIKE SHE modelling system of DHI, Denmark. It is fully integrated spatially-distributed model, that includes all components of the hydrological cycle, such as precipitation, evapotranspiration, overland and river flows, as well as their interactions with the subsurface in the unsaturated and the saturated zone. The model has a spatial discretization of 500 x 500 m, and covers an area of about 346 km2, of which the upstream 199 km2 are located in Belgium (Flanders), while the rest is in the downstream part in the Netherlands (in the Province of North Brabant). The model is run with distributed precipitation available from three gauging stations in the area (using Thiessen polygons method), and with reference evapotranspiration data available from another station. For introducing spatial distribution of land use and vegetation, the land use map from the Corine Land Cover (CLC 2018) for Europe by Copernicus Land Monitoring Service is used, with paramaters from the NHI (Nederlands Hydrologisch Instrumentarium). Spatial distribution of soils is based on European Soil Database Center (EUSDAC), and their hydraulic characteristics have been calculated by the Rosetta model of USDA. Organic carbon content in soils is based on vegetation (land cover), estimated from literature. The Aa of Weerijs river is modelled with its natural cross sections and including all relevant structures (weirs with their control water levels), as provided by the Water Board Brabantse Delta (WBD). For the interactions with the sub-surface, one aquifer layer has been introduced with a thickness of 80 m, whose charactersistics have been taken from the Dutch REGIS II hydrogeological model. The smaller drainage network (its levels and spatial distribution) has also been provided by WBD.
This model has been calibrated and validated, and then used for assessing hydrological conditions in the base period (2010-2019), specifically during summers, when water shortages and droughts may occur. The same model has then be used for assessing such conditions under influence of climate change, and with climate adaptation strategies using Nature-Based Solutions (NBSs). Some example inputs and model results for the year 2018 (most critical in terms of drought within the base period) can be seen below.
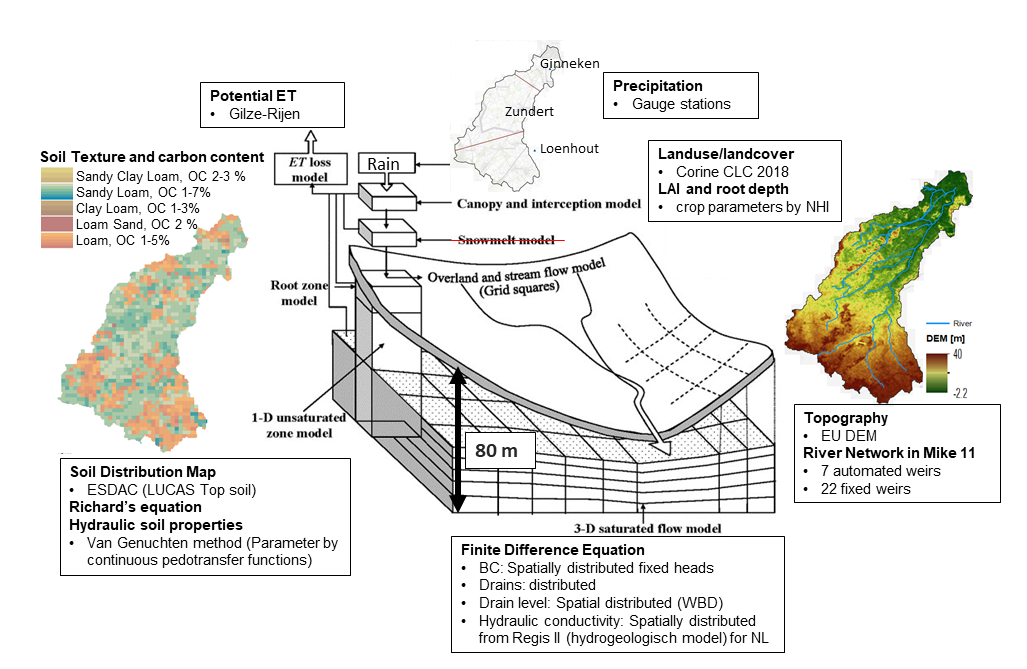
Summary of Aa of Weerijs hydrological model, set up in MIKE SHE

The hydrological model for Aa of Weeriijs has been calibrated and validated using observed data in the period 2009 - 2019. The period 2009-2016 was used for calibration, while the period 2017-2019 (three very dry years) was used for validation. During calibration, parameters representing the sub-surface have been modified, mainly boundary conditions for the saturated zone (head specified), hydraulic conductivity of the aquifer and some drainage levels. To check the performance of the model the observed data for river discharge (3 stations), groundwater levels (13 stations) and actual evapotranspiration (satellite data) were used.
Overall, the modell has good performance, and can be used for assessing current and future hydrological conditions. Some results of the calibration and validation are presented in the corresponding figures in this section.
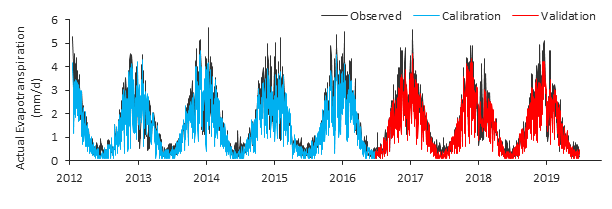
Actual evapotranspiration for the whole catchment, calibration and validation results
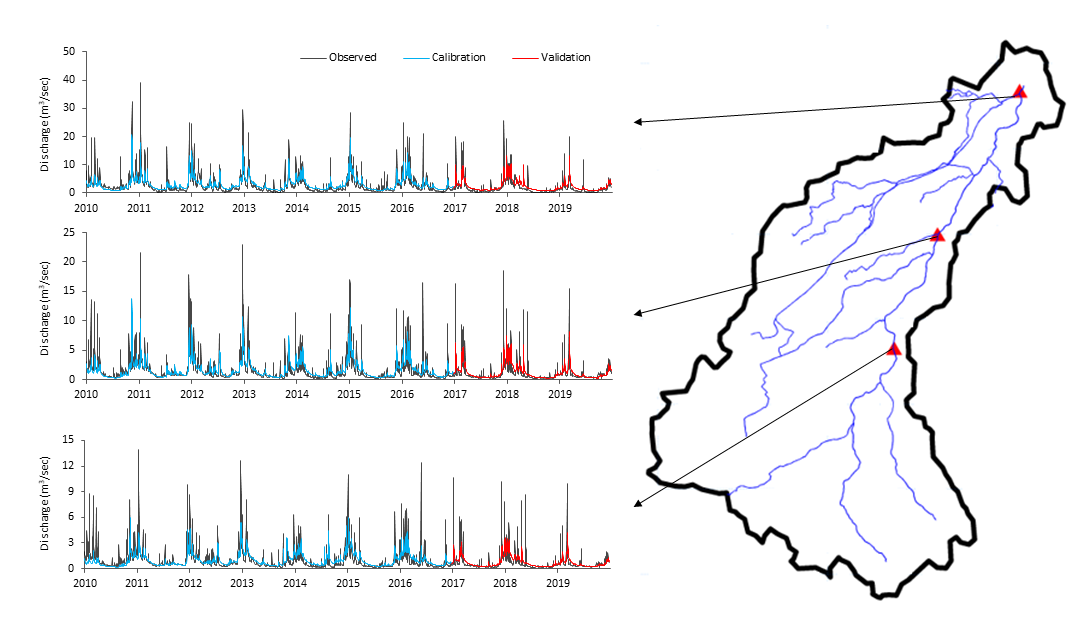
River discharge, calibration and validation results
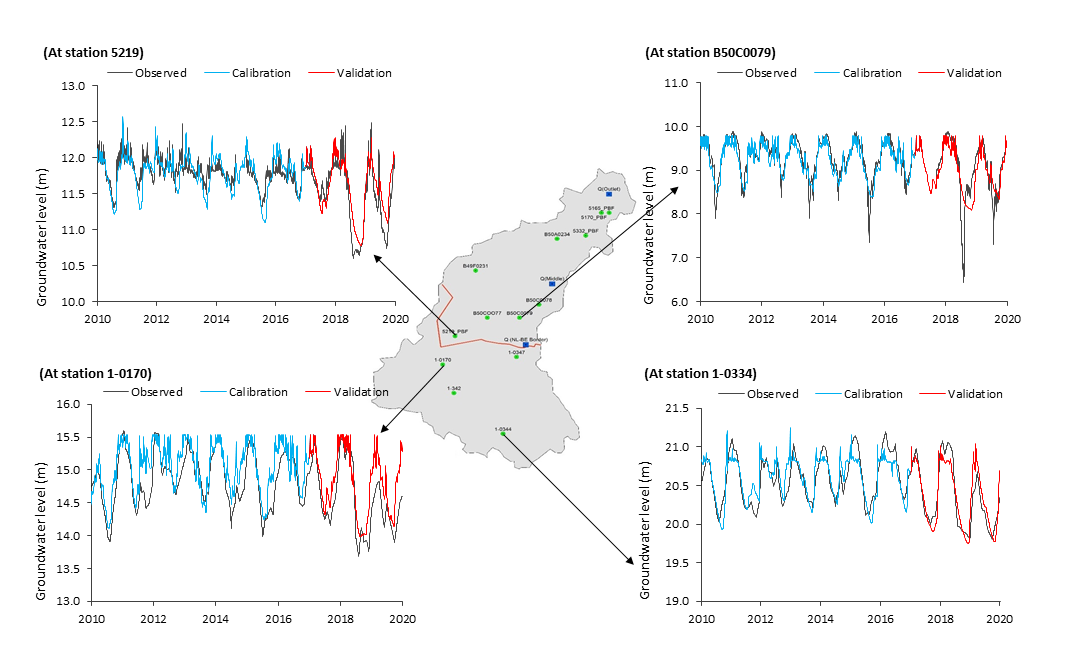
Groundwater levels, calibration and validation results