Combined adaptation strategies
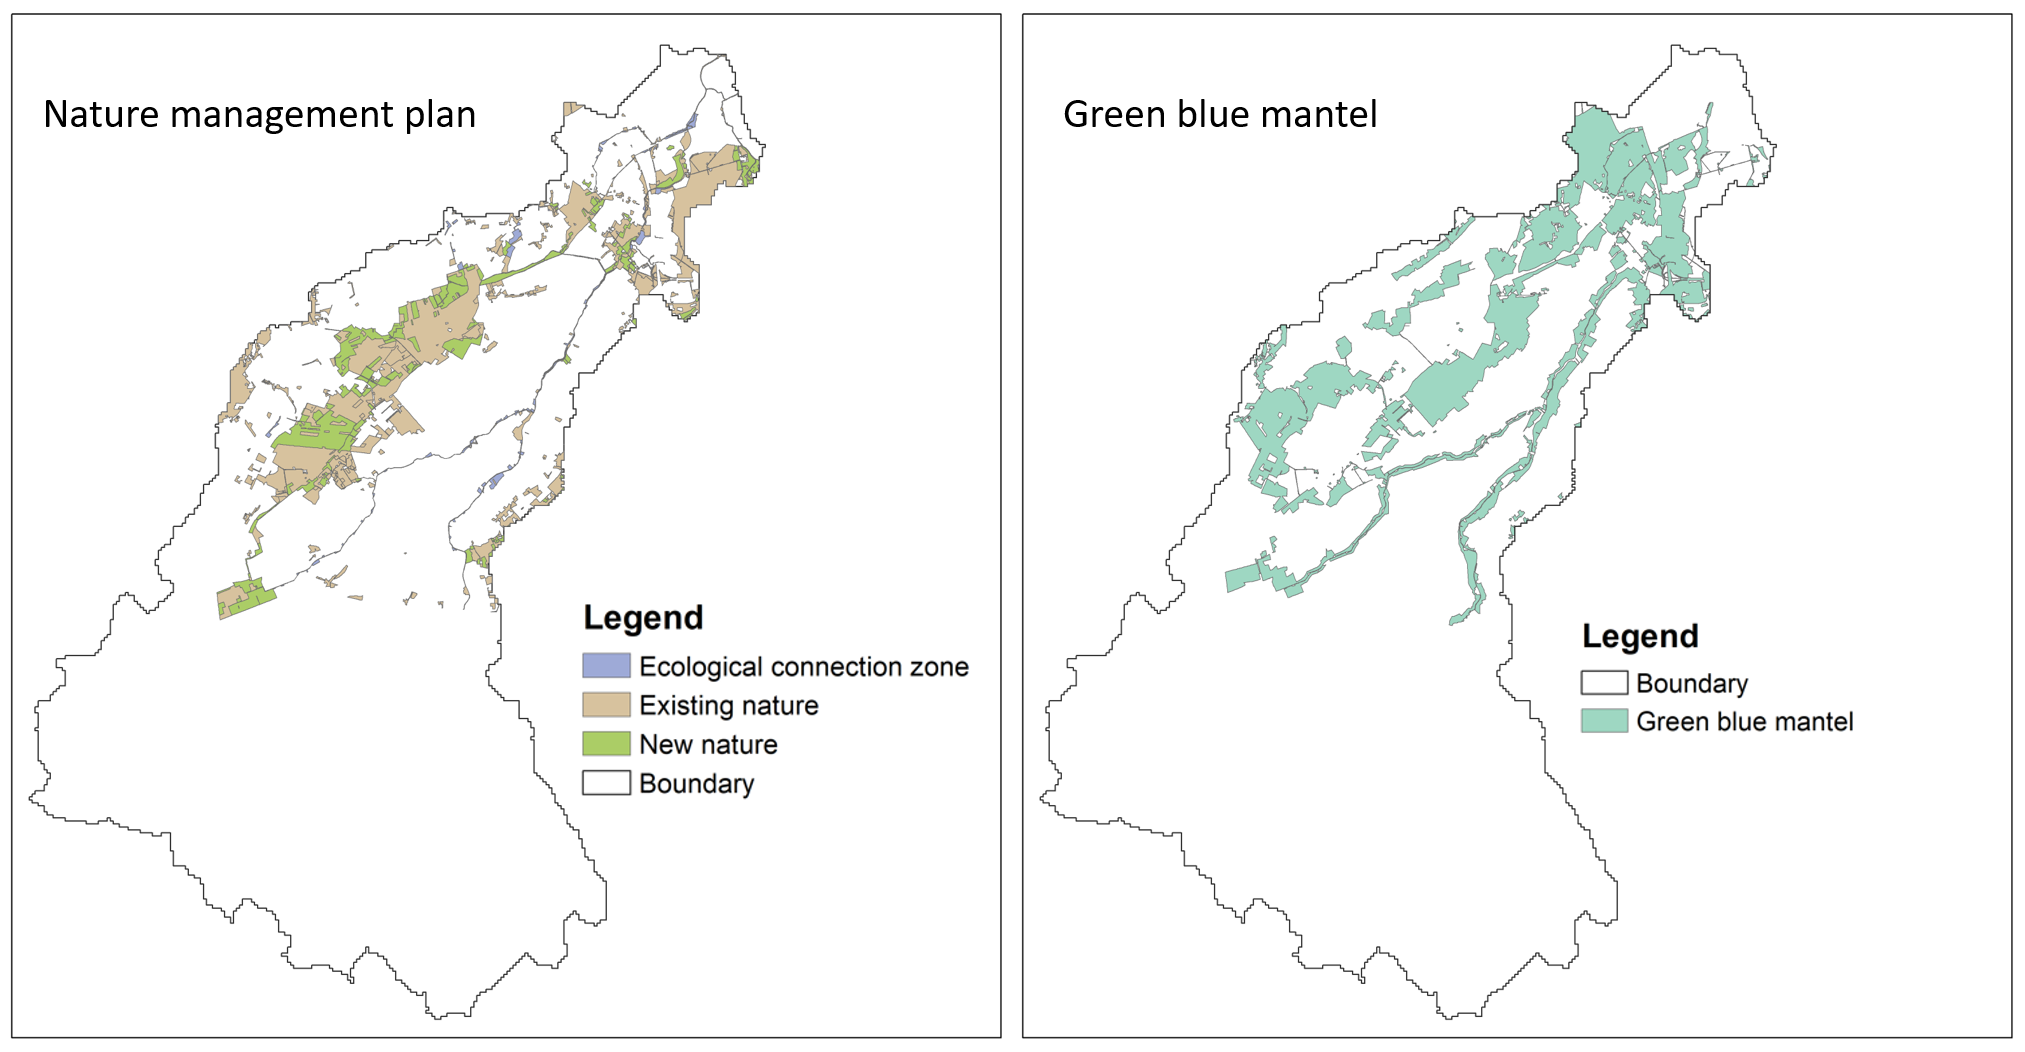
When developing the combined drought-related adaptation strategies (consisting of different NBS solution types spatially), first consideration was to determine the spatial placement of nature-based solutions across the area. For this purpose, the existing Nature Management Plan (NMP) of the North Brabant Province (NBP) was consulted. This plan is based on the Nature Network of Brabant, which represents areas designated for nature development during the 1990s. The spatial extent of this plan is presented on the left in the figure to the right. In addition to the NMP, an additional area was considered, known as the “Green Blue Mantel” (GBM). The GBM represents a buffer area surrounding the Nature Network of Brabant and is identified to serve as a secondary function for nature and water (see again the figure to the right). According to North Brabant Province’s policy, the GBM is intended for the development of a climate-proof and resilient water system, as well as nature and landscape enhancement.
Spatial data regarding NMP and GBM were obtained from the Georegister of the Province of North Brabant.
Nature areas within Aa of Weerijs catchment considered for NBS adaptations
Two combined adaptive strategies were then formulated using the following procedure:
Strategy S1:
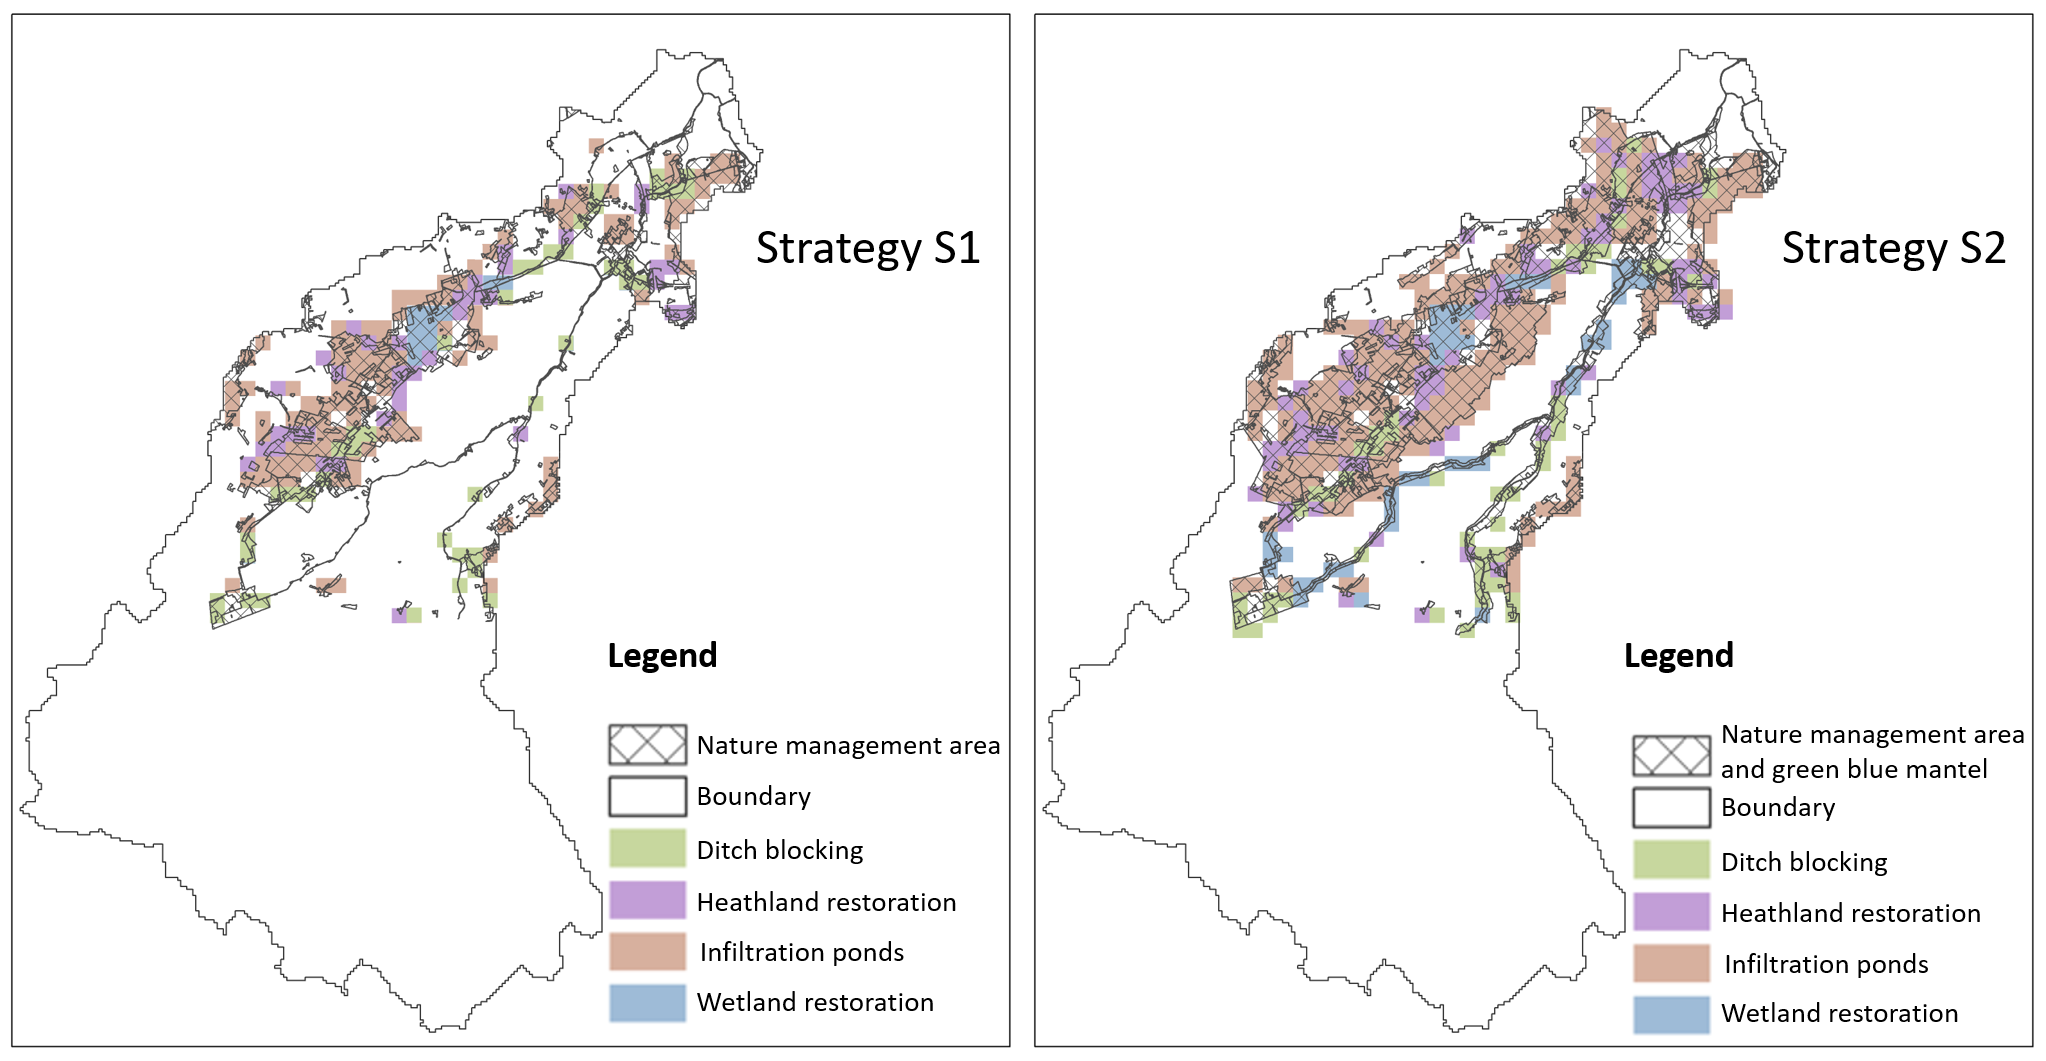
Initially, the performance of each single-measure adaptation strategy was checked for positive impact on the KPI of groundwater availability (GWA). Ditch blocking, Wetland restoration, Infiltration ponds, and Heathland restorations were identified as NBS measures with such positive impact in any model grid. Locations where the individual measures had a negative impact on GWA were excluded. The final locations of these NBS measures were then determined based on the magnitude of positive impact that each individual measure provided. In cases of conflicting locations, priority was given to the single measure that provided larger positive impact. However, ditch blocking could be combined with other individual measures, so these were provided at all locations where the impacts were positive on GWA. After finalizing the locations of these NBS measures, their spatial distribution was restricted to the area identified as the Nature Management Plan (NMP).
Strategy S2:
For Strategy S2, the locations of the NBS measures were determined using the same methodology, with spatial distribution that included the GBM, in addition to the NMP, as depicted in the figure to the right.
Combined adaptation strategies within Aa of Weerijs catchment
Overall conclusions: In general strategy S2 gives better results, simply because larger areas are devoted to NBSs. Also, the effects on groundwater availability are much more pronounced than on surface water availability. Zones with implemented NBSs are having more positive effects, compared to those without NBSs. Finally, the positive effects are more noticeable in the downstream part of the catchment (close to the city of Breda). As there are no NBSs in the Belgian part of the catchment, the effects there are practically absent.
Use the section below to check the performance of the two strategies in terms of different KPIs, under 'HD' climate change scenario (most severe).